Below we discuss the different options that are available on version 2 of the Liquidation Levels V2 indicator:
If you are familiar with TradingView indicators then probably most of the options are obvious.
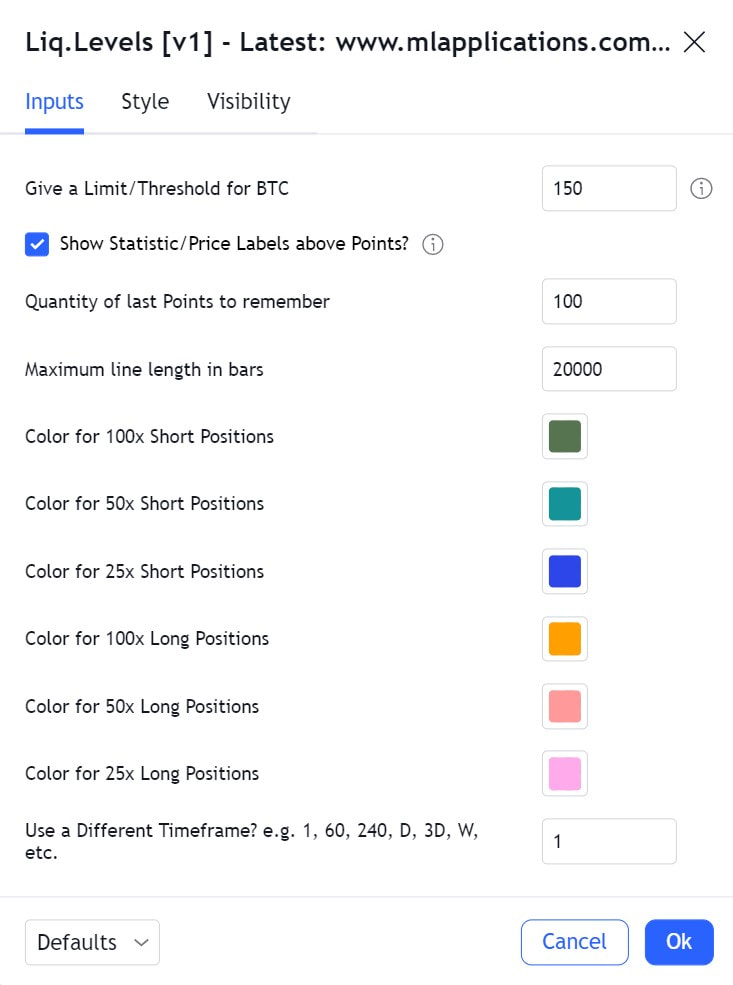
The first option (Give a limit/Threshold for BTC) is the most crucial one. You can switch between different values. For each change you make, give Trading View some time (usually 4-10 seconds) to recalculate the chart from the beggining. From our personal experience so far, you should not use BTC low limit less than 75 BTC. The larger is your down limit that you specify in the settings, the more important is that level (let’s say that it a new large position will be interesting for the Market Maker=possible target , high chances).
The last optionuse a different timefame is extremely useful when you want to Zoom Out on a higher Timeframe than the 1 minute . You may switch the chart to e.g. 1 Hour and by using this setting the calculations for the liquidity zones will take place on 1 minute (= the actual price level) ! Here, the option 1 is the 1 minute timeframe.
Second option is to enable/disable labels on the points of liquidation points. If you use a small limit for BTC, then there will be many lines and perhaps the text on the labels will cover each other making them unreadable. Just disable this and keep using the colors.
The 3rd and 4th option (quantity of last points and maximum length in bars) are less useful. Moreover, the maximum length in bars will be probably removed in future versions. The quantity of last points goes maximum to 250 because using more here, pushes the TradingView buffers and calculations to each limits.
The color options on the bottom (for 100x Longs, 50x Shorts, etc), are free to change, but it is preffered to keep them different, in order to optical make the distinction of the various levels.
The different levels of liquidity that provide interest for us, are divided into 3 categories for each of the possible moves, based on the level of leverage that a trader may use when opened a position (100x, 50x and 25x). One may ask: Is this hypothesis valid? Well, at this stage we don't want ot fully analyze the exact calculation we do insinde the indicator, but imagine the following: For any new positions that created inside a minute, there exist all possible combinations of leveraging. But, usually, traders with 100x leverage risk small amounts, and traders with low leverage (less than 10x or 5x use larger amount of their portofolio. Because of the leverage (amount x 5 or amount x 100) we assume that each different level is "equal" to another. This is an assumption and this calculation may change in the next versions, based on your feedback or ideas!
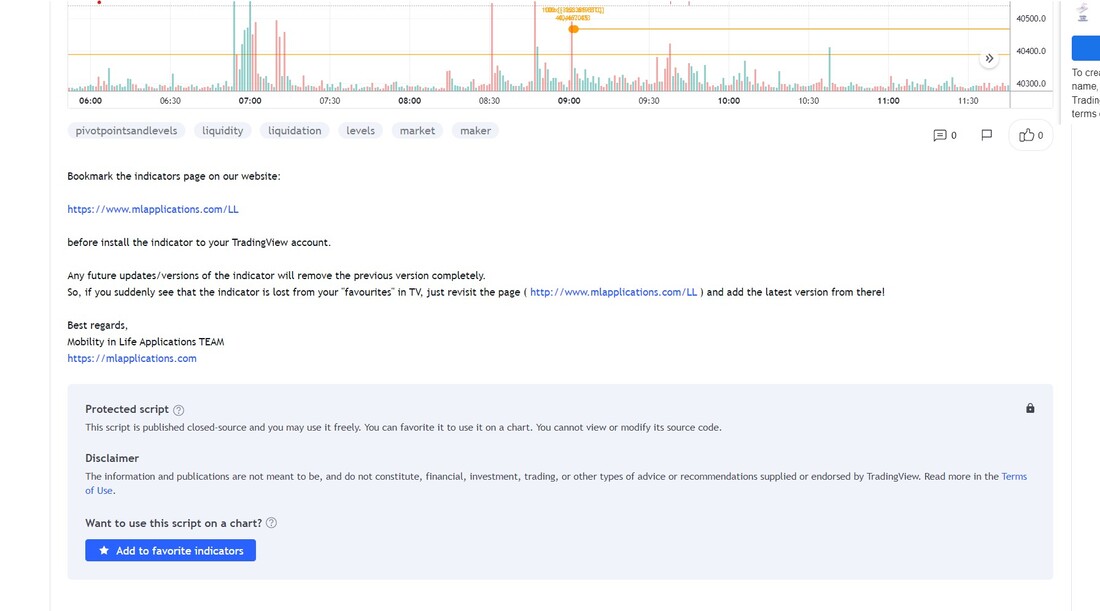
How to install...!
(latest version: 2.0, Release Date: December 28, 2022)
Click on the button below to open the indicator's page on the Trading View. (It is also searchable from the community's scripts).