Is it accurate ? validation of results ...!
Below we present something we wanted to share publicly, since we started the development of the Liquidations Levels V2 indicator, 1.5 year ago for the Trading View platform.
We think it is useful, because It has to do with the accuracy of the result and the indicator.
We compare what you might think it happened (when using the indicator) with the reality, what really happened in the charts.
We think it is useful, because It has to do with the accuracy of the result and the indicator.
We compare what you might think it happened (when using the indicator) with the reality, what really happened in the charts.
Some things first ...!
To be honest:
The accuracy of the results was always a question inside our mind. If we couldn't validate the calculations in reality, then the indicator is useless or it might lead to misunderstanding or, worse, misinterpretation.
The indicator is trying to calculate the other traders, large over-leveraged positions at the time they opened, plot them in the chart exactly when they opened and to track the pair Price Action (or re-action) for these.
The Market Maker, is always, hunting these positions and is trying to create Max Pain for the traders that open these type of positions, by hitting them, usually in bunches/groups of them, with wicks or aggressive moves.
Liquidation Levels V2 calculations: In order to do the correct calculations, we were forced to make (like on every algorithm) some mini-assumptions about the calculations.
...It's like the Fast Fourier Transform sampling (FTT) coming from the Signal Processing Theory, we have learned in Communications on University, many years ago...
The sampling rate, the interval, the period are extremely important parameters. Especially here, for each parameter, even a change of 0.01 percent will lead to different results. So we must be accurate (!).
The results ...!
for the BTC / USDT perpetual futures: Binance, Release Date: January 13, 2023)
So... The 1 million dollars ($) question:
Does the indicator calculates the levels of real liquidations? Is the MM actually liquidate trades positions in the indicators levels we have calculate? Can we trust the indicator in the Trading View?
Does the indicator calculates the levels of real liquidations? Is the MM actually liquidate trades positions in the indicators levels we have calculate? Can we trust the indicator in the Trading View?
The answer is YES.
It is a 100% validation..!
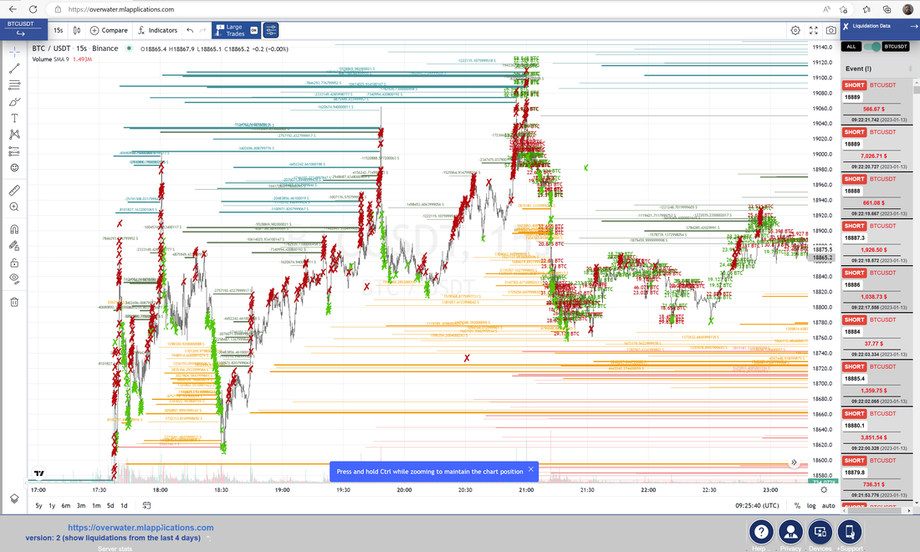
You can also view the chart in more detail here: BTCUSDT - Liquidations.
After a long time, we have finally managed to plot all the real time liquidations that happened in a Binance Futures pair, directly in the same chart with the Liquidation Levels V2 indicator .
The liquidation data are collected by the official feed from the Binance API.
So, every green "X" you see in the chart, is a single liquidation of a Long Position and every red "X" is the liquidation of a Short Position.
On the same chart there are also plotted the Liquidation Levels V2 indicator with their lines.
I think the chart speaks for it self. Check where (and when) the liquidation levels plot a new line (meaning, new short or longs positions opened at the exact time, and also have their liquidation price on the exact price/line), and check, when the BTCUSDT price went finally there, that real liquidations happened (the "X"s).
Where can I find/use the chart ...?
The chart as you see it above can be extremely powerful, as it combines data from different sources in an innovative way.
We, as a compoany, are in the development stage of our personal but public charting website. Right now, (13 of Jan 2023), we have completed nearly the 3/7 of the total features that the finally website charting platform will have. Namely:
If you are interested, you could take a look on the link below:
https://overwater.mlapplications.com
If you have an extra idea, or you think that we have forgot something, please, share it with us either through email:
We, as a compoany, are in the development stage of our personal but public charting website. Right now, (13 of Jan 2023), we have completed nearly the 3/7 of the total features that the finally website charting platform will have. Namely:
- Large trades / Deltas based on aggregated trades but with dynamic filtering based on statistical 24h trades for the pair (!)
- Liquidations Levels V2
- Real Liquidations that actually happened (real time)
If you are interested, you could take a look on the link below:
https://overwater.mlapplications.com
If you have an extra idea, or you think that we have forgot something, please, share it with us either through email:
mil.applications [ at ] hotmail.com
Where can I find/use the indicator...?
If you think that we have forgot something, or if there is something extra that you may want to add, please, share it with us either through email:
mil.applications [ at ] hotmail.com
Best regards,
the Mobility in Life Applications TEAM


